Topological Data Analysis
One interesting way to think about data analysis is through the lens of topology—really just the lens of “what is the shape of this thing”? By looking at a more general idea of shape, we can uncover patterns that a basic data science toolset (SVMs and regressions, for example) would have real difficulty ever picking up on. This can be especially helpful when exploring an extremely complex, multidimensional dataset that doesn’t have intuitive boundaries for how new examples should be interpreted.
For example, suppose we had a dataset that looked like this:
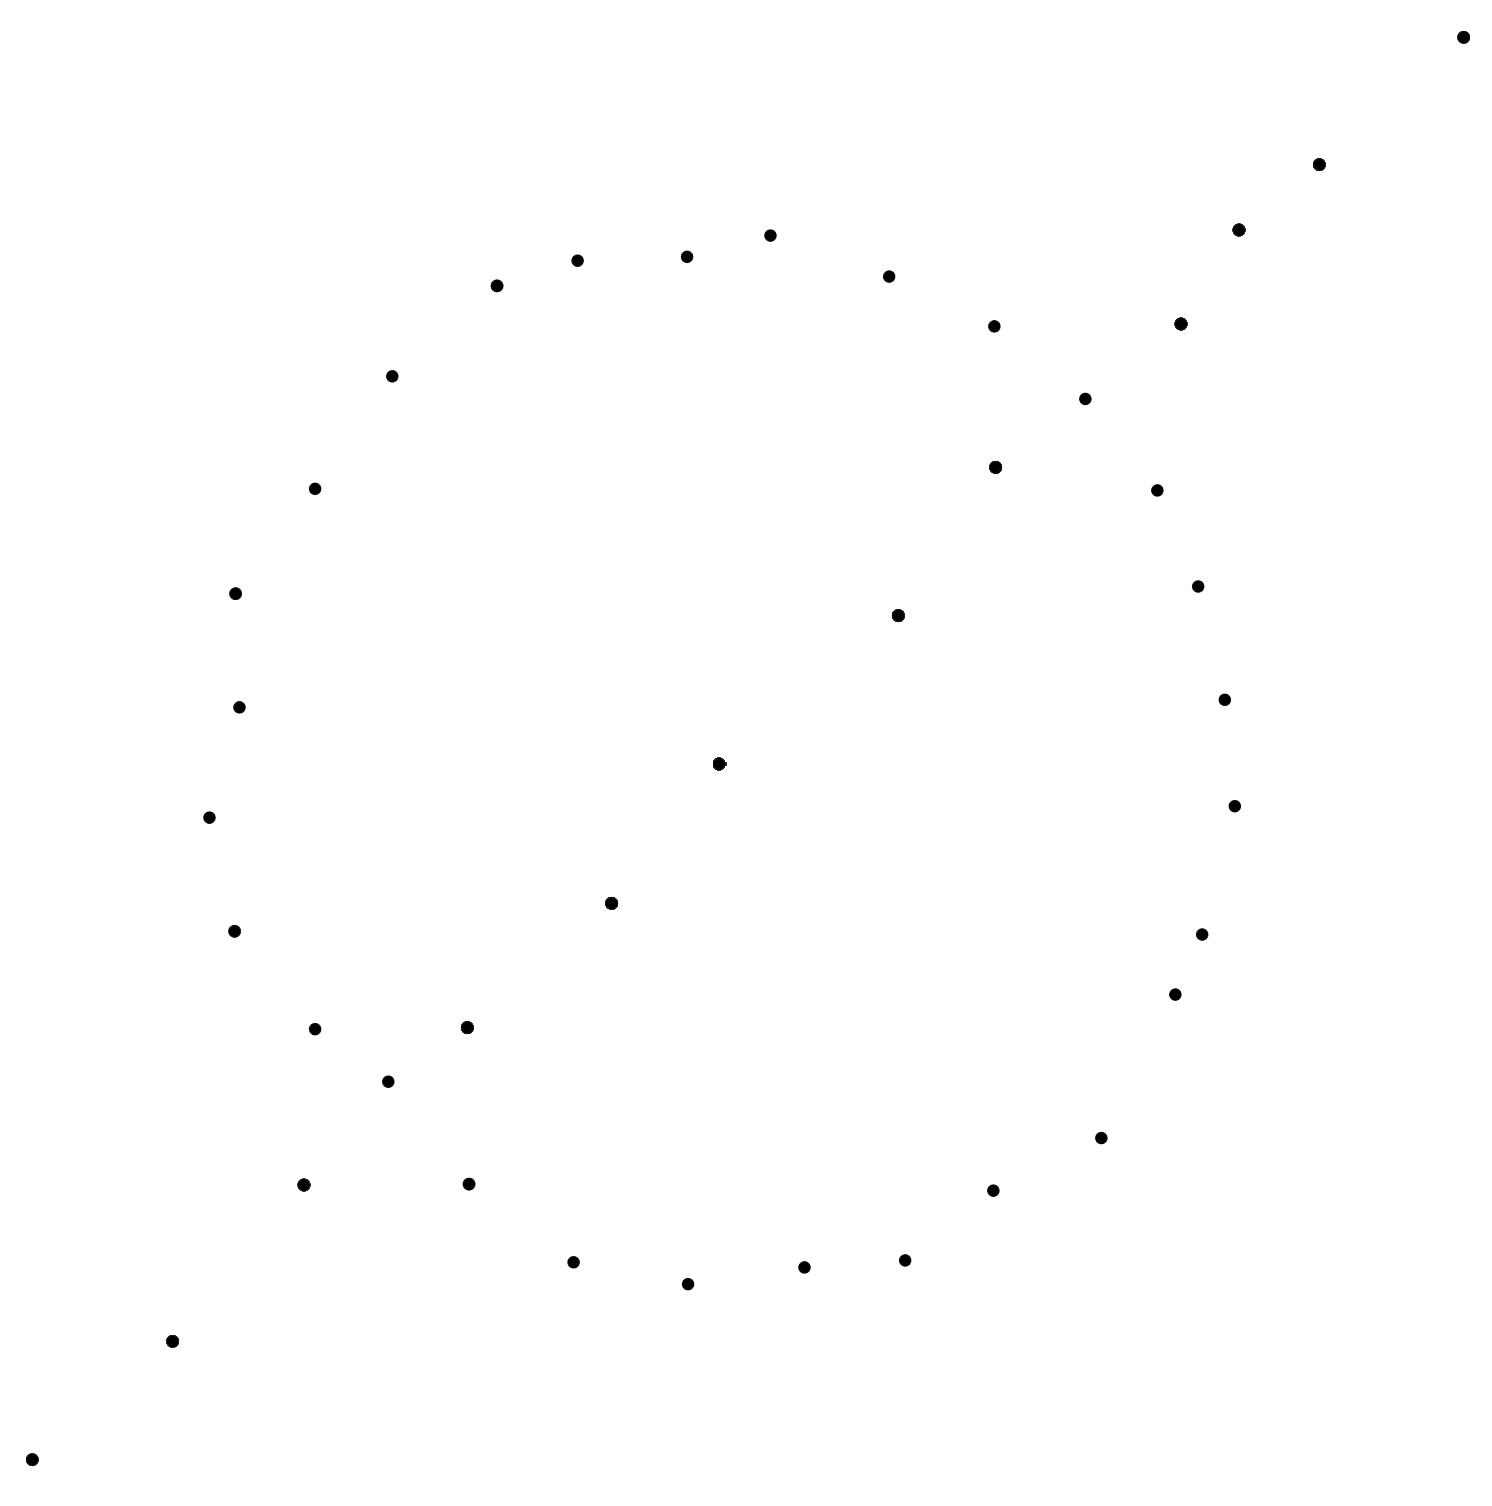
How might we end up with such a weird setup? One possible way is dimensionality reduction. Imagine that we have a higher-dimensional dataset which acts like a mixture of multiple datasets when we reduce it to two dimensions. Here, it’s pretty easy to imagine that one of our datasets was circular, maybe due to being expressed in polar coordinates or something, and the other ends up looking linear when we squash out extra information and move down to only two dimensions.
Obviously, there’s no linear “cut” we can draw through these points to separate them into the two humanly-obvious categories (the circle and the line). Even slightly more advanced techniques like means clustering won’t work. The “interaction” points (where the line intersects the circle) are also pretty tricky to understand using typical models.
One clever trick we can use is to, instead of using our dataset as a cloud of points, treat it as a network of points linked by their nearness in space. Let’s connect each point to its three closest neighbors, and see what kind of network we come up with:
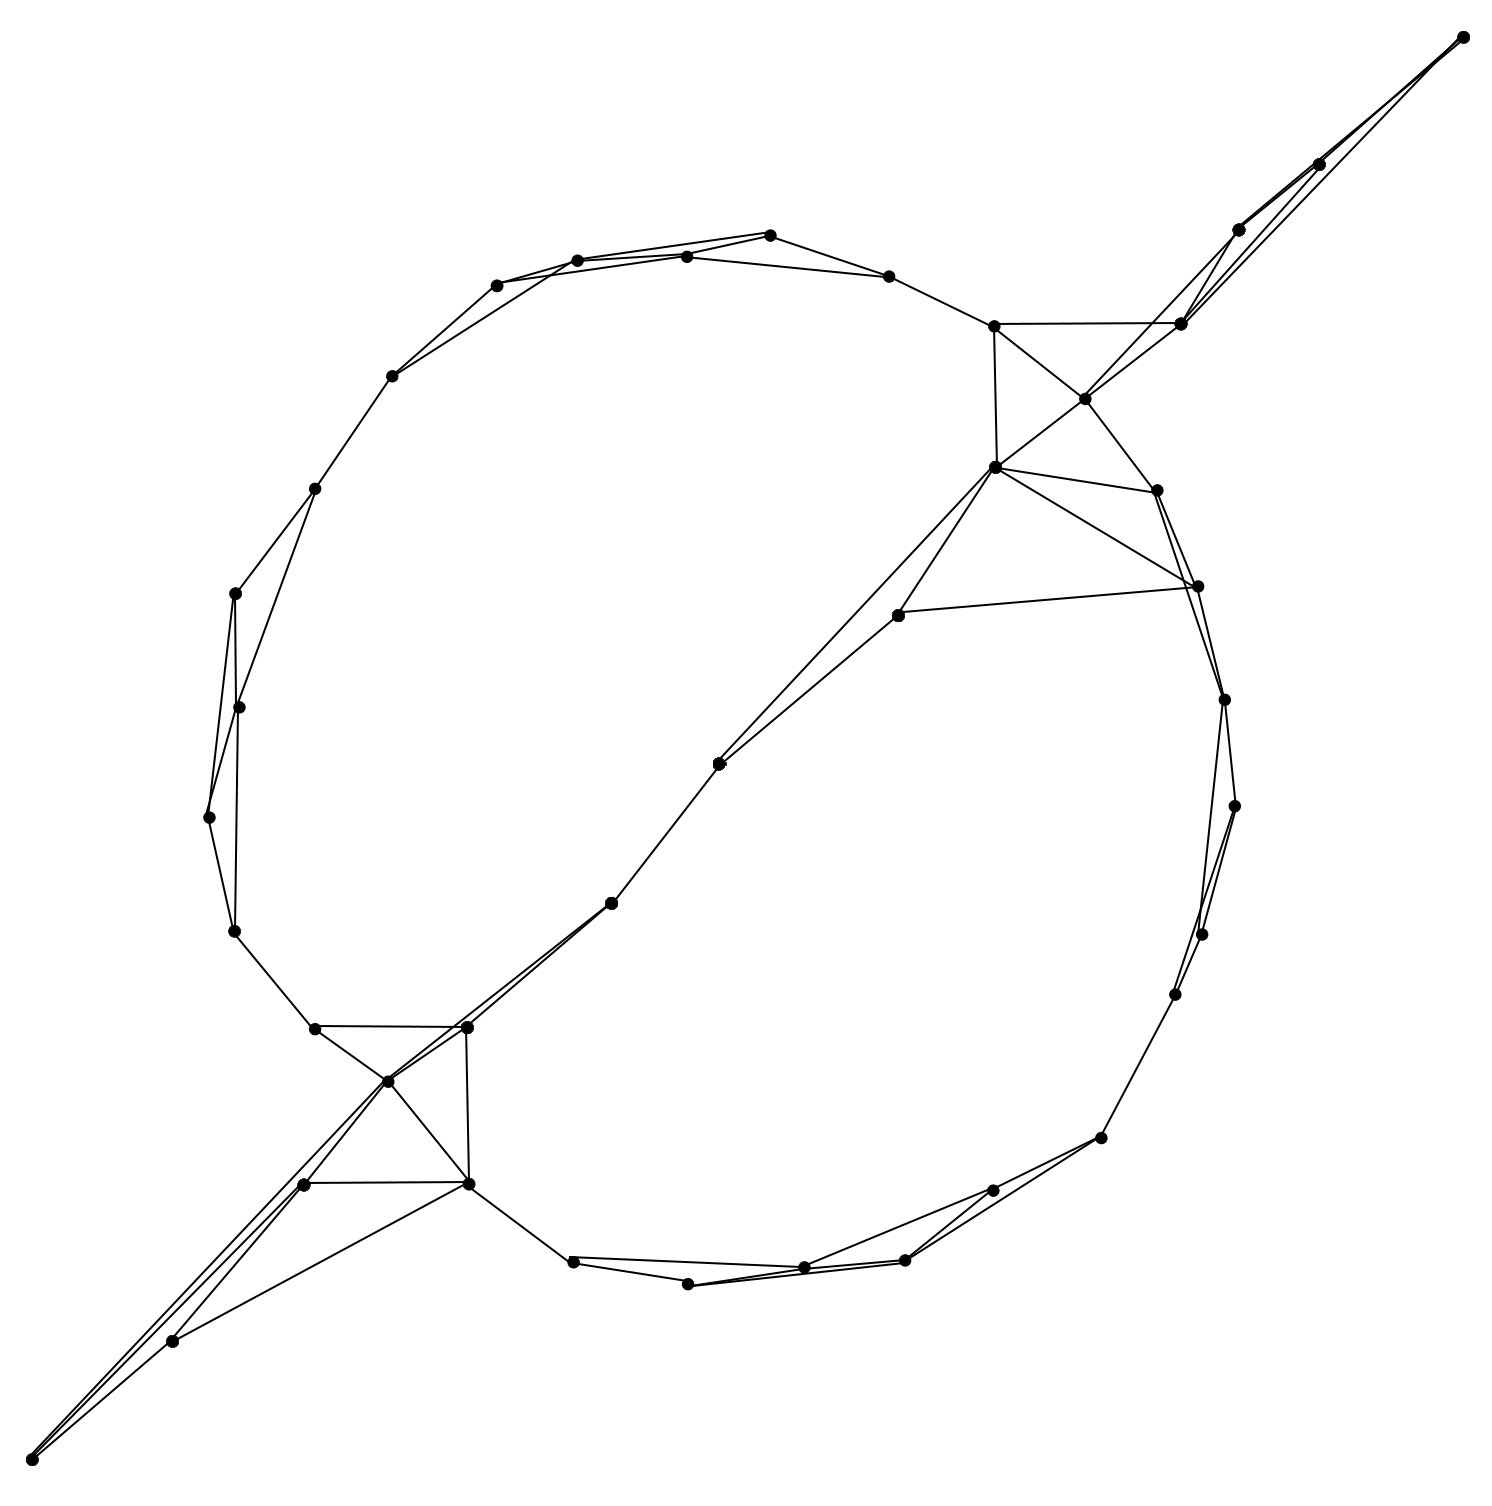
Not too bad. Just by applying the automatic filter of connecting to nearby neighbors, we end up with a network that more-or-less resembles the actual shape of the data itself. However, this model is still a bit too complex to be entirely useful and easy to understand. It’s like having a decision tree with thousands of branches—it may represent the underlying distribution well, but it’s just too complicated for humans to make good use of it.
We can use a couple ideas from the topological toolkit to reduce this network into something more workable. In topology, there’s an idea of the “genus” of surfaces. Roughly, a sphere has no “holes” so it’s genus zero. A torus, or donut (or coffee cup) has one “hole” in its surface, so it’s genus one. A figure-eight-looking double torus is genus two. What matters, topologically speaking, isn’t any detail of the surface’s shape, besides how many of these “holes” or discontinuities it has in it. In fact, we’re allowed to mentally deform the surface as much as we want, so long as we don’t close up a hole or perform a few other invalid operations.
Networks can have a similar notion of “holes”, or different paths to get from place to place. Let’s look at some possible reductions we might use to simplify our currently over-complicated network:

On the left, we see a transformation from a network with an extra node in the middle, to the straightforward piece of wiring from the start to the end point. We’re allowed to make this change because of transitivity. If I can reach the midpoint from the start, and the endpoint from the midpoint, then I can reach the endpoint from the start.
On the right is a similar-seeming transformation. If there are two possible paths from the start to the end, but they don’t go anywhere else in between, then we might as well collapse them into one path. This illustrates why we have to be careful when choosing what reductions to apply, because applying this kind of thing willy nilly might result in collapsing the “holes”, or the important structural information we were seeking about the network in the first place. In this case, it’s easy enough to have a heuristic that collapses holes beneath a certain size (that is, if the path traveled around the hole is small enough), but to leave larger holes open.
After applying these kinds of transformations, we might end up with a simplified network like this:
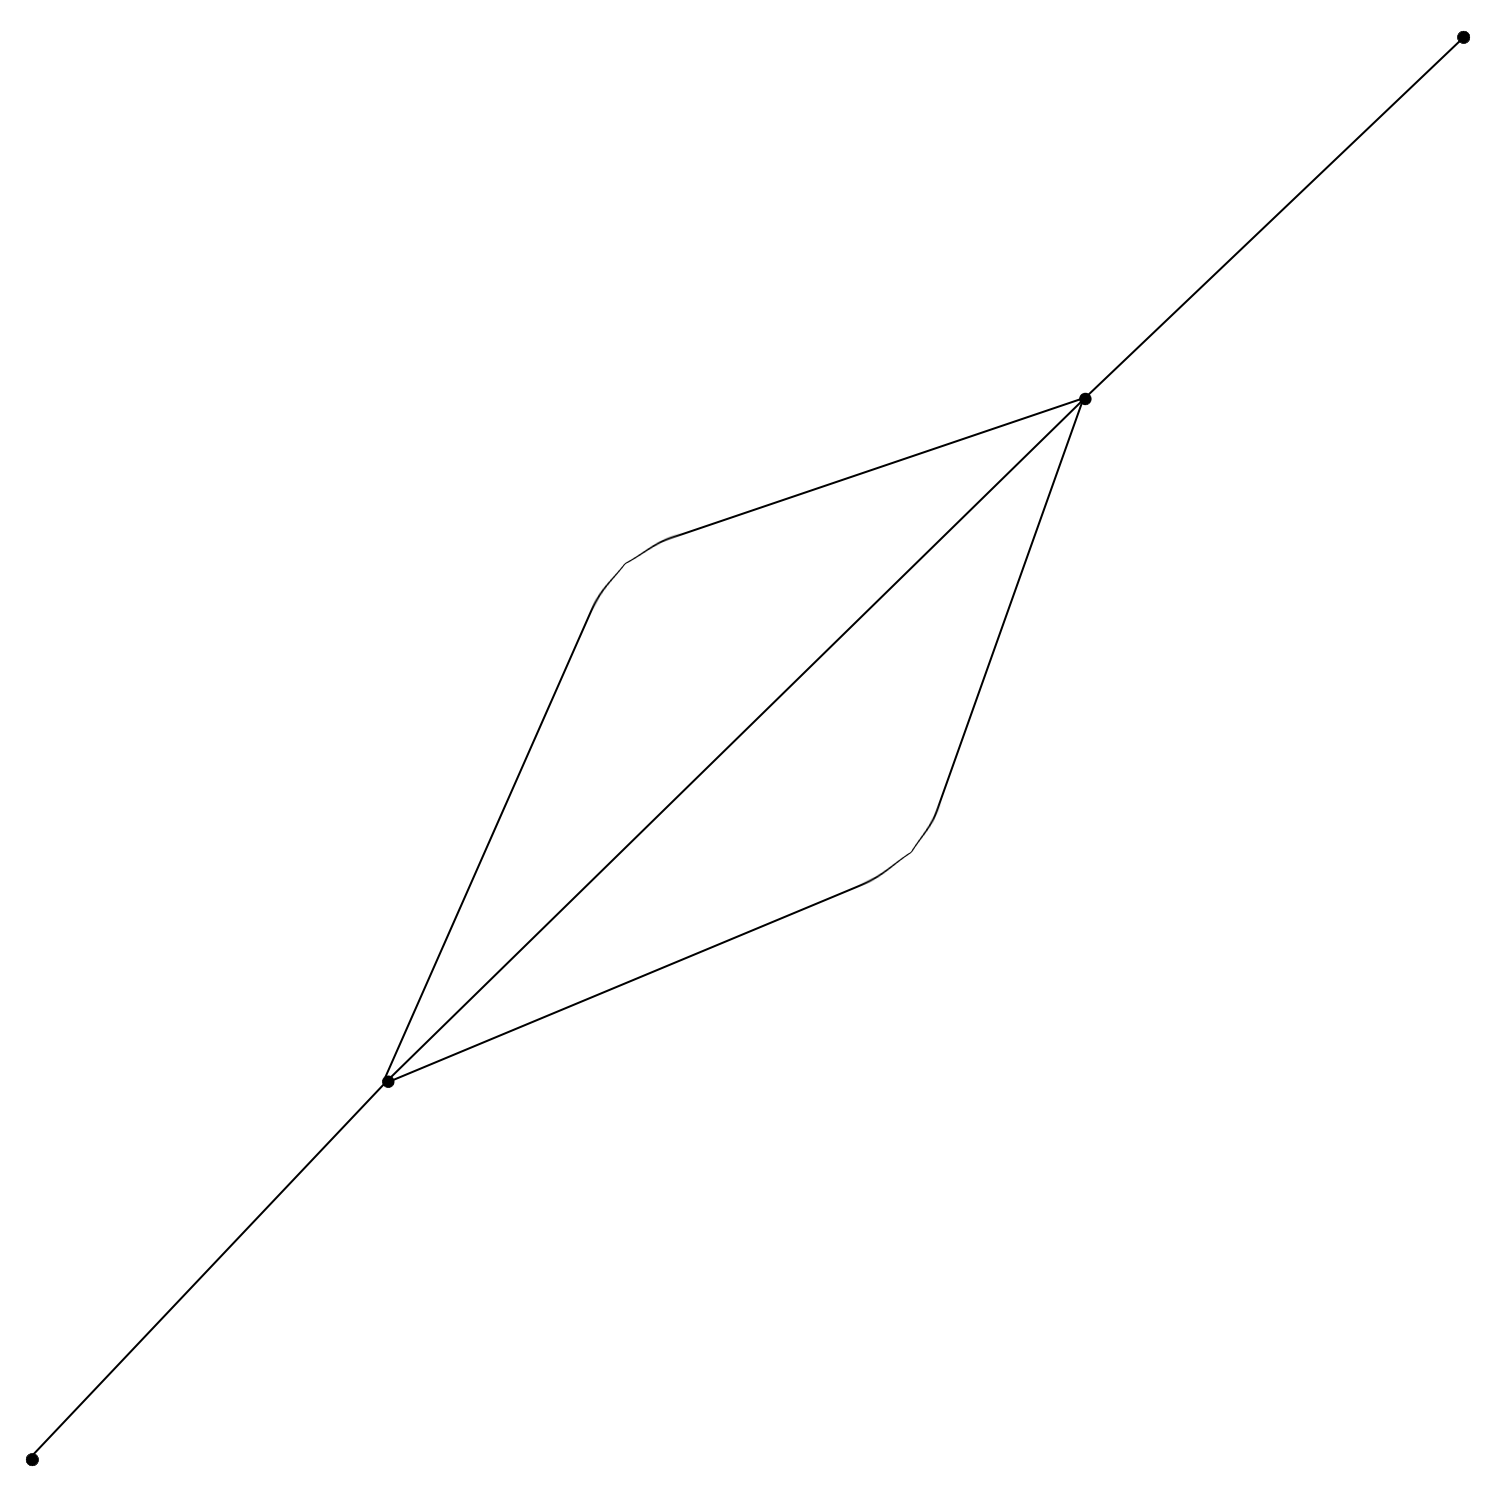
Besides being an easier mental model to work with, and capturing the shape of our original dataset fairly nicely, the way I’ve drawn this also has one extra benefit. If we place a random point on this new drawing of the simplified network, our classification of whether it belongs to the circle or the line can be determined by its distance to the closest part of the network. If it’s closer to the straight line, we classify it as belonging to the line, but if it’s closer to the curved lines, we classify it as part of the circle.
This kind of nice geometrical interpretation isn’t always available at the end, but merely being able to view datasets as networks and discover their underlying shapes through some fairly simple transformations is fairly useful and interesting by itself.